Cluster Overview#
The Cluster Overview page in the WebUI provides a comprehensive view of your HPE Machine Learning Development Environment cluster’s status, resource utilization, and configuration. This page is accessible to users with appropriate permissions and offers valuable insights into cluster performance and management.
Accessing the Page#
To access the Cluster Overview:
Sign in to the WebUI.
From the left navigation pane, select Cluster.
The overview will be the default view under the Cluster section.
Page Components#
The Cluster Overview page consists of several key components:
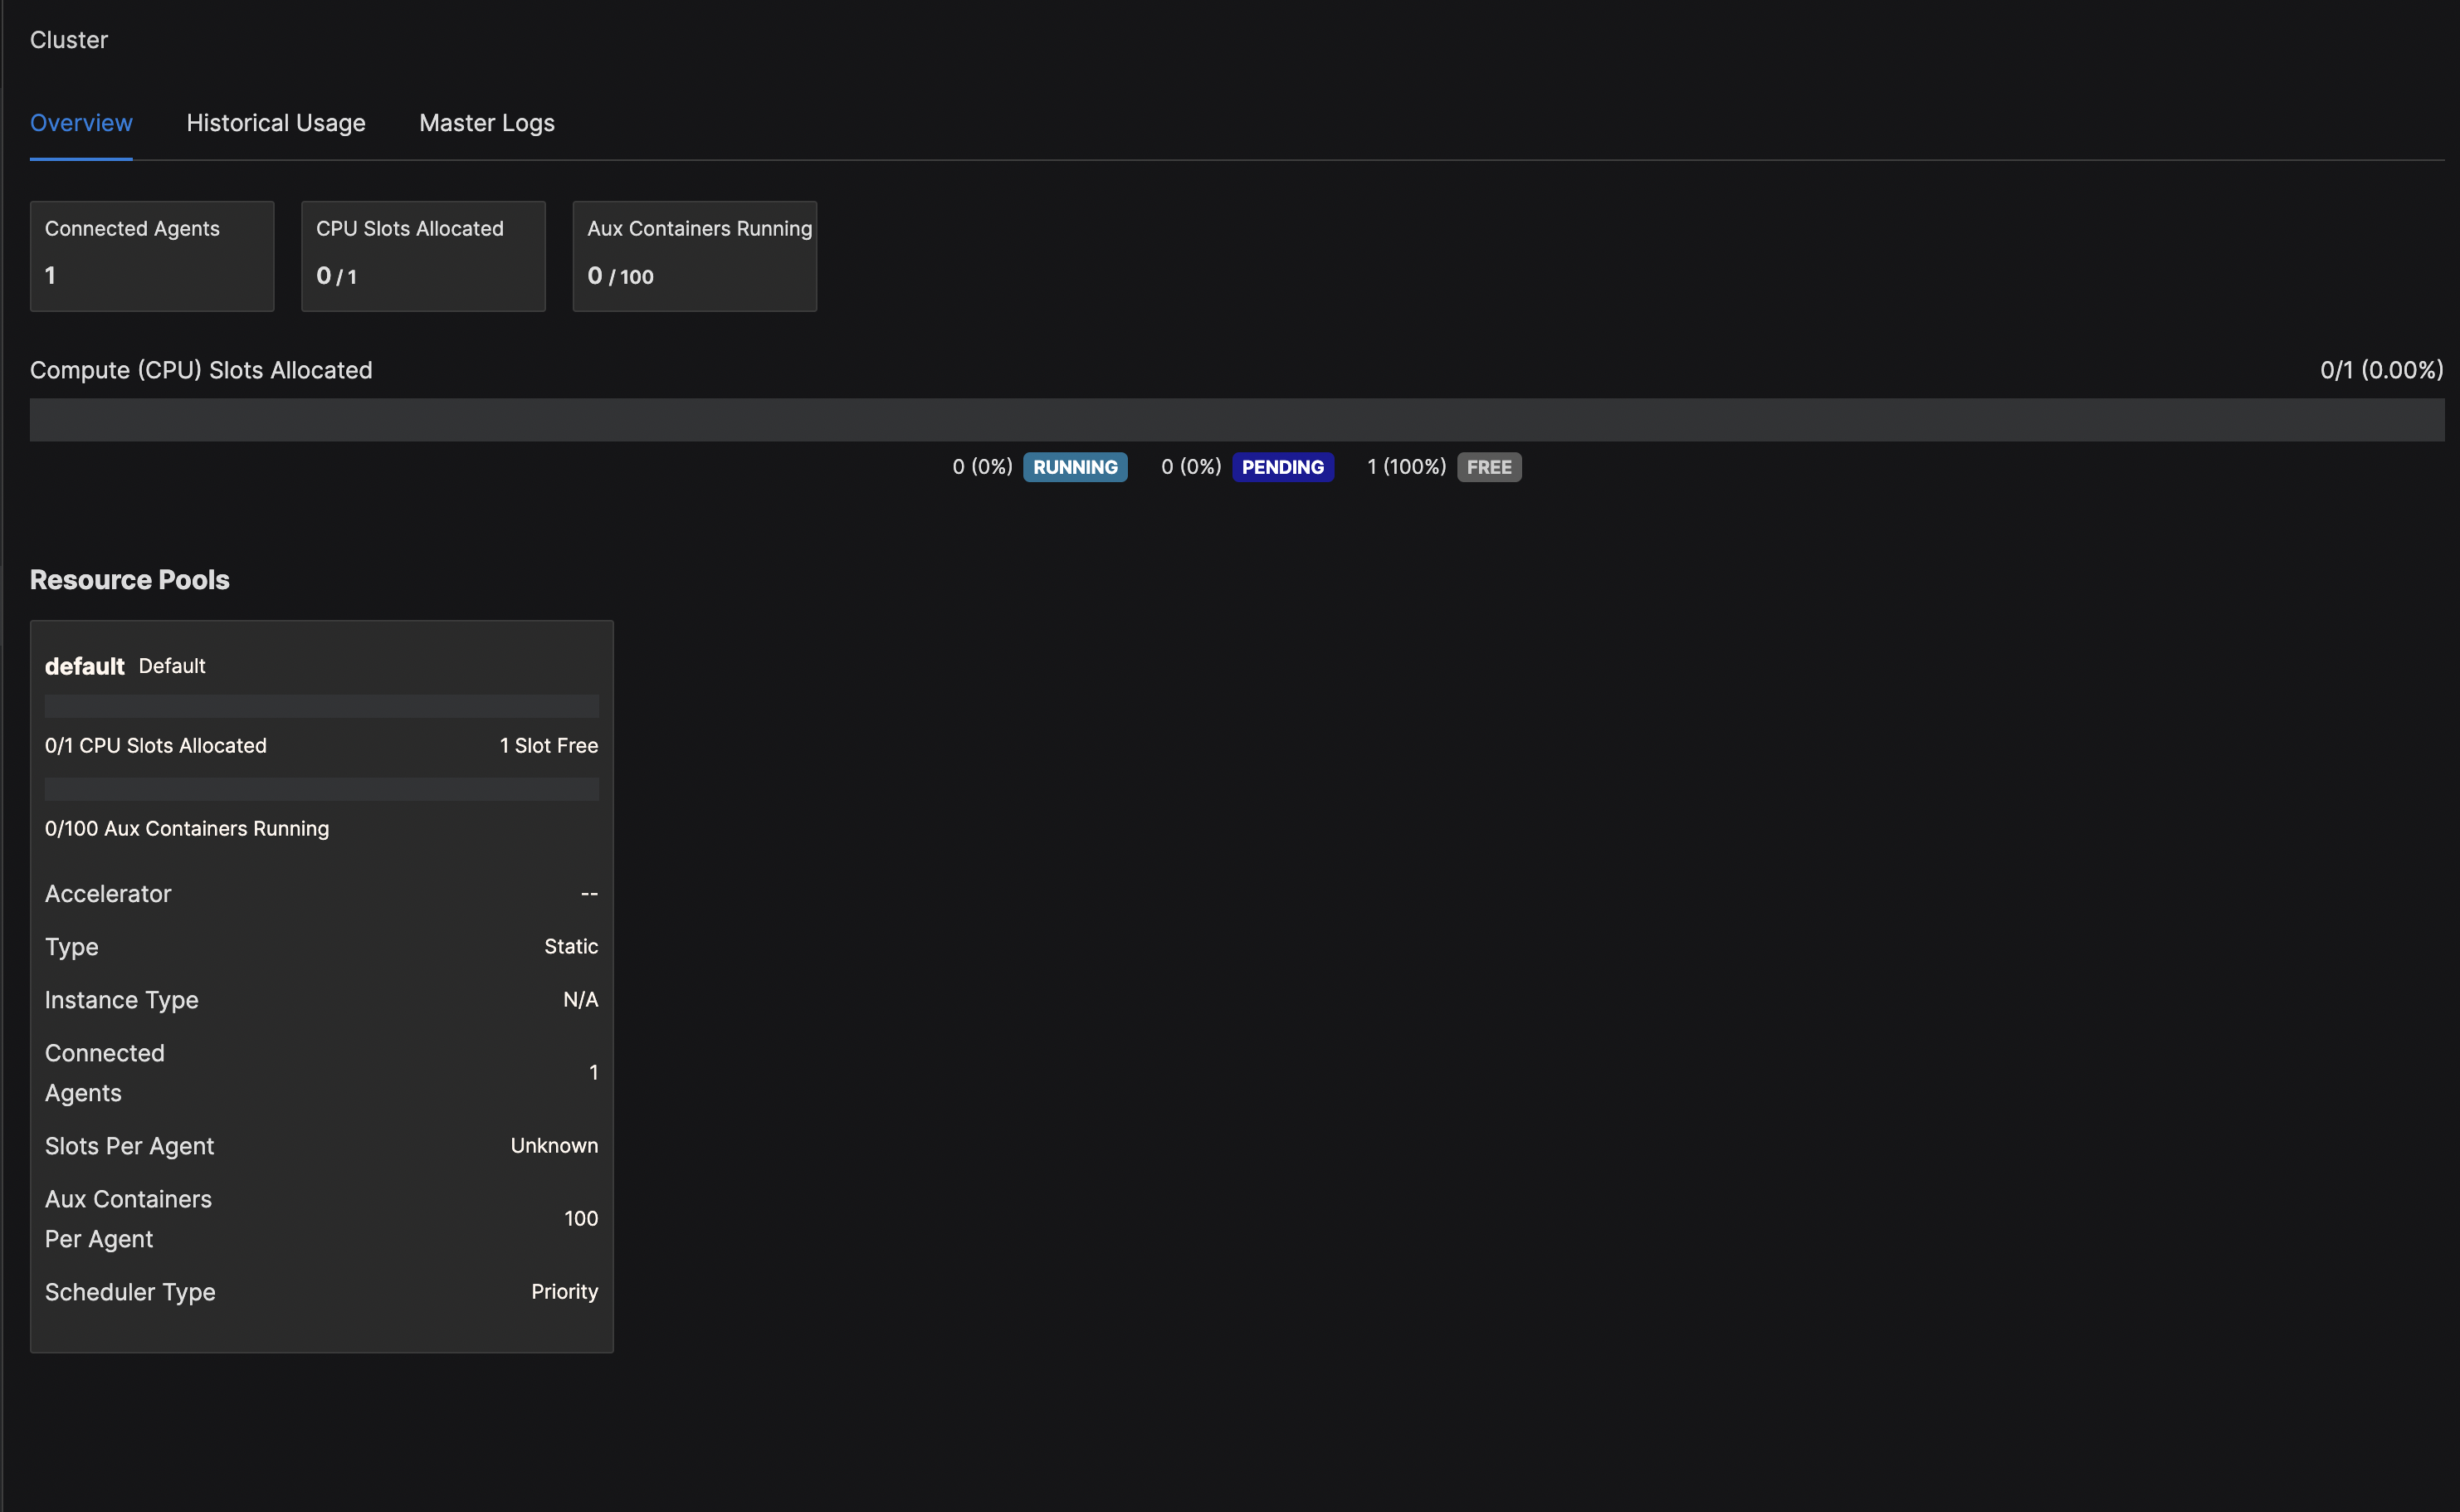
Resource Utilization#
This section displays real-time information about the cluster’s resource usage:
Connected Agents: The number of agents currently connected to the cluster.
CUDA Slots Allocated: The number of CUDA (GPU) slots currently in use out of the total available.
CPU Slots Allocated: The number of CPU slots currently in use out of the total available.
Aux Containers Running: The number of auxiliary containers currently running out of the total capacity.
Active Searches: The number of active hyperparameter searches.
Slots Allocated Bars#
The slots allocated bars provide a visual representation of resource utilization across the cluster:
Compute (CUDA) Slots Allocated: Shows the utilization of GPU resources.
Compute (CPU) Slots Allocated: Shows the utilization of CPU resources.
Each bar is divided into sections:
Running (Blue): Currently active slots.
Pending (Purple): Slots allocated but not yet active.
Free (Gray): Available slots.
The percentage and fraction of used slots are displayed on the right side of each bar.
Resource Pools#
This section lists the configured resource pools, providing detailed information for each:
Pool Name: The name of the resource pool (e.g., pool1, pool2).
Slots Allocated: Shows the number of slots in use and the total available. - For pools with mixed resource types (both CUDA and CPU), it displays “Unspecified Slots Allocated”. - For pools with a single resource type, it specifies the type (e.g., “CUDA Slots Allocated”).
Aux Containers: The number of auxiliary containers running out of the total capacity.
Additional Information: Includes details such as Accelerator type, Instance Type, Connected Agents, Slots Per Agent, and Scheduler Type.
Note: The presence of “Unspecified Slots Allocated” indicates that the pool contains both CUDA and CPU agents. While this is allowed, it is considered a suboptimal configuration and will be logged as an error. It’s recommended to separate CUDA and CPU resources into different pools for better management and allocation.
For more details on resource pools, visit Resource Pools.
Cluster Topology#
A visual representation of the cluster’s node and GPU distribution:
Each node is displayed with its unique identifier
The number of available and in-use slots on each node
GPU types (if applicable)
To view detailed topology information:
Navigate to Resource Pools from the Cluster section.
Select a specific Resource Pool.
Look for the Topology section in the resource pool details page.
Job Queue#
An overview of the current job queue, including:
Number of queued jobs
Job priorities
Estimated start times
For more information on managing the job queue, see Managing the Job Queue.
Cluster Configuration#
Key configuration settings for the cluster, such as:
Master node information
Scheduler type
Version information
Actions#
From the Cluster Overview page, administrators can perform several actions:
Modify resource pool settings
Adjust job queue priorities
Access detailed logs and metrics
For specific instructions on these actions, refer to the respective documentation sections.
Troubleshooting#
If you encounter issues or need more information about cluster management, visit the Troubleshooting guide or contact your system administrator.