Historical Cluster Usage Data#
HPE Machine Learning Development Environment provides insights into the usage of your cluster, measured in compute hours allocated. Note that this is based on allocation, not resource utilization. For example, if a user has 1 GPU allocated but uses only 20% of it, we still report one slot-hour.
Warning
The total used compute hours reported by HPE Machine Learning Development Environment may be less than those reported by the cloud provider. This discrepancy occurs because we do not include idle time (e.g., waiting for a GPU to become active or when a GPU is not scheduled with any jobs).
Warning
Data is aggregated by HPE Machine Learning Development Environment metadata (e.g., label, user) nightly. Therefore, any data visualized on the WebUI or downloaded via the endpoint reflects the state as of the previous night. Changes to the metadata of a previously run experiment (e.g., labels) will be updated after the next nightly aggregation.
Note
When using the export to CSV functionality, slot_hours reflects only the slot hours used
during the export time window. This means that allocations overlapping the export window have
their slot-hours calculated only for the time within the window. As a result, allocations not
starting and ending within the export window may appear to have incorrect slot-hours when
calculated manually from their start and end times.
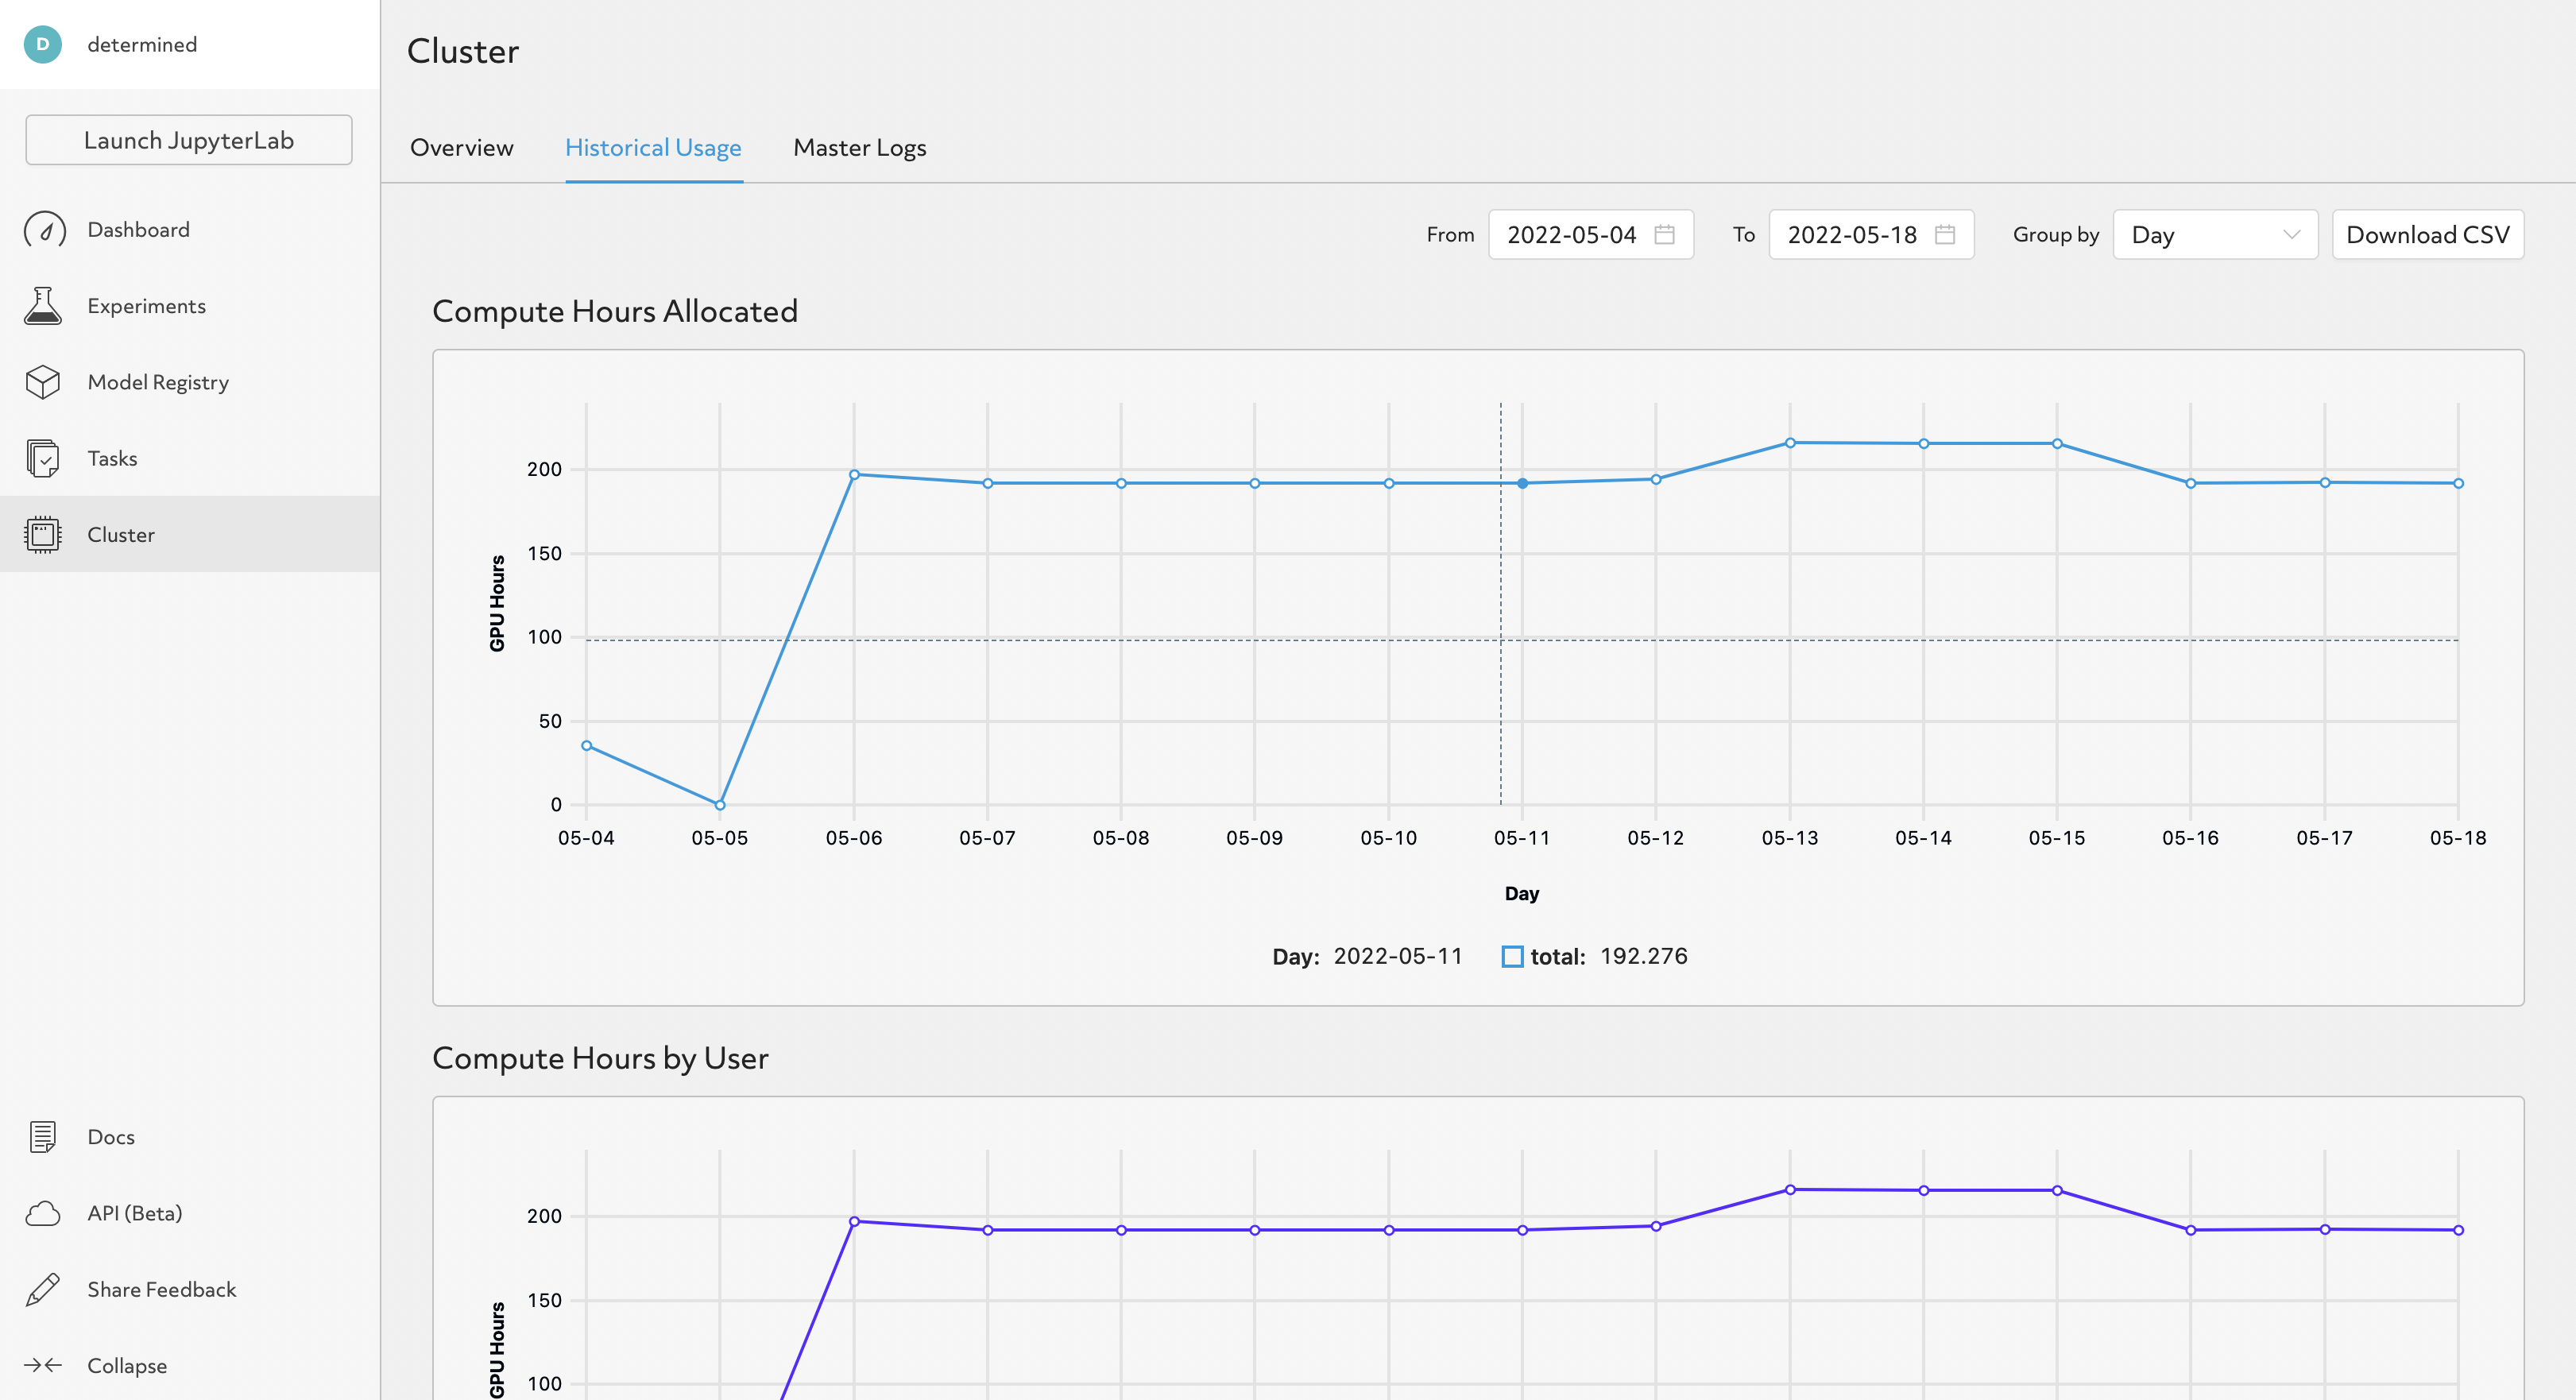
WebUI Visualization#
WebUI visualizations provide a quick snapshot of the historical cluster usage:
Command-line Interface#
Alternatively, you can use the CLI or the API endpoints to download resource allocation data for analysis:
det resources raw <start time> <end time>: Get raw allocation information. Times are in the format yyyy-mm-ddThh:mm:ssZ.det resources aggregated <start date> <end date>: Get aggregated allocation information. Dates are in the format yyyy-mm-dd.